Nissan: Vehicle HMI
Our team partnered with Nissan to design a comprehensive digital cockpit and supporting mobile ecosystem for their upcoming flagship electric crossover. The design framework relied on deep global ethnographic research to address the unique psychological shifts of driving an electric vehicle. As the UX Lead, I directed the foundational international field studies, mapped the multi-display information architecture, and led an intensive iterative testing cycle. The final output was a fully functional, high-fidelity physical testing buck that allowed Nissan executives to experience the future vehicle interface in real time.
My role: UX Lead (Field Research, Information Architecture, Usability Validation)
Agency: Punchcut
Duration: 8 months
Output: Working multi-screen in-vehicle prototype and interactive system models
Technical Discovery and Alignment
Before starting visual or structural layouts, we needed to map out the technical constraints of the vehicle platform. I led collaborative workshops with Nissan engineering and product stakeholders to establish a unified product vision. This phase focused on identifying technical hardware specifications, screen resolution limits, and upcoming vehicle milestone timelines to ensure our designs were realistic for production.
Recruiting Filters (Not Just Basic Personas)
Nissan provided internal segment data that gave us a foundation for our research targets. We used these archetypes to build a rigorous recruiting filter for our upcoming international field study, ensuring we captured feedback from distinct driving demographics including suburban families, urban professionals, and tech-skeptical seniors.
Global Contextual Field Research
Our fieldwork covered three major metropolitan regions: the San Francisco Bay Area, London, and Manchester. The goal was to study how drivers naturally interact with their entire mobility ecosystem. For current electric vehicle owners, we wanted to witness the physical reality of when, where, and how they charged their cars. For traditional drivers, we evaluated their underlying anxieties and perceptions regarding shifting to electric power.
I conducted these two-hour interviews inside the participants' homes and vehicles. Our research protocol included a contextual interview, a vehicle blueprinting exercise where users drew out their physical spatial needs, and an in-car driving demo. We finished each session with a concept card-sort to test early feature ideas.
Core Behavioral Themes
Across twenty-eight deep-dive interviews, we noticed clear behavioral patterns. We grouped these findings into three strategic pillars:
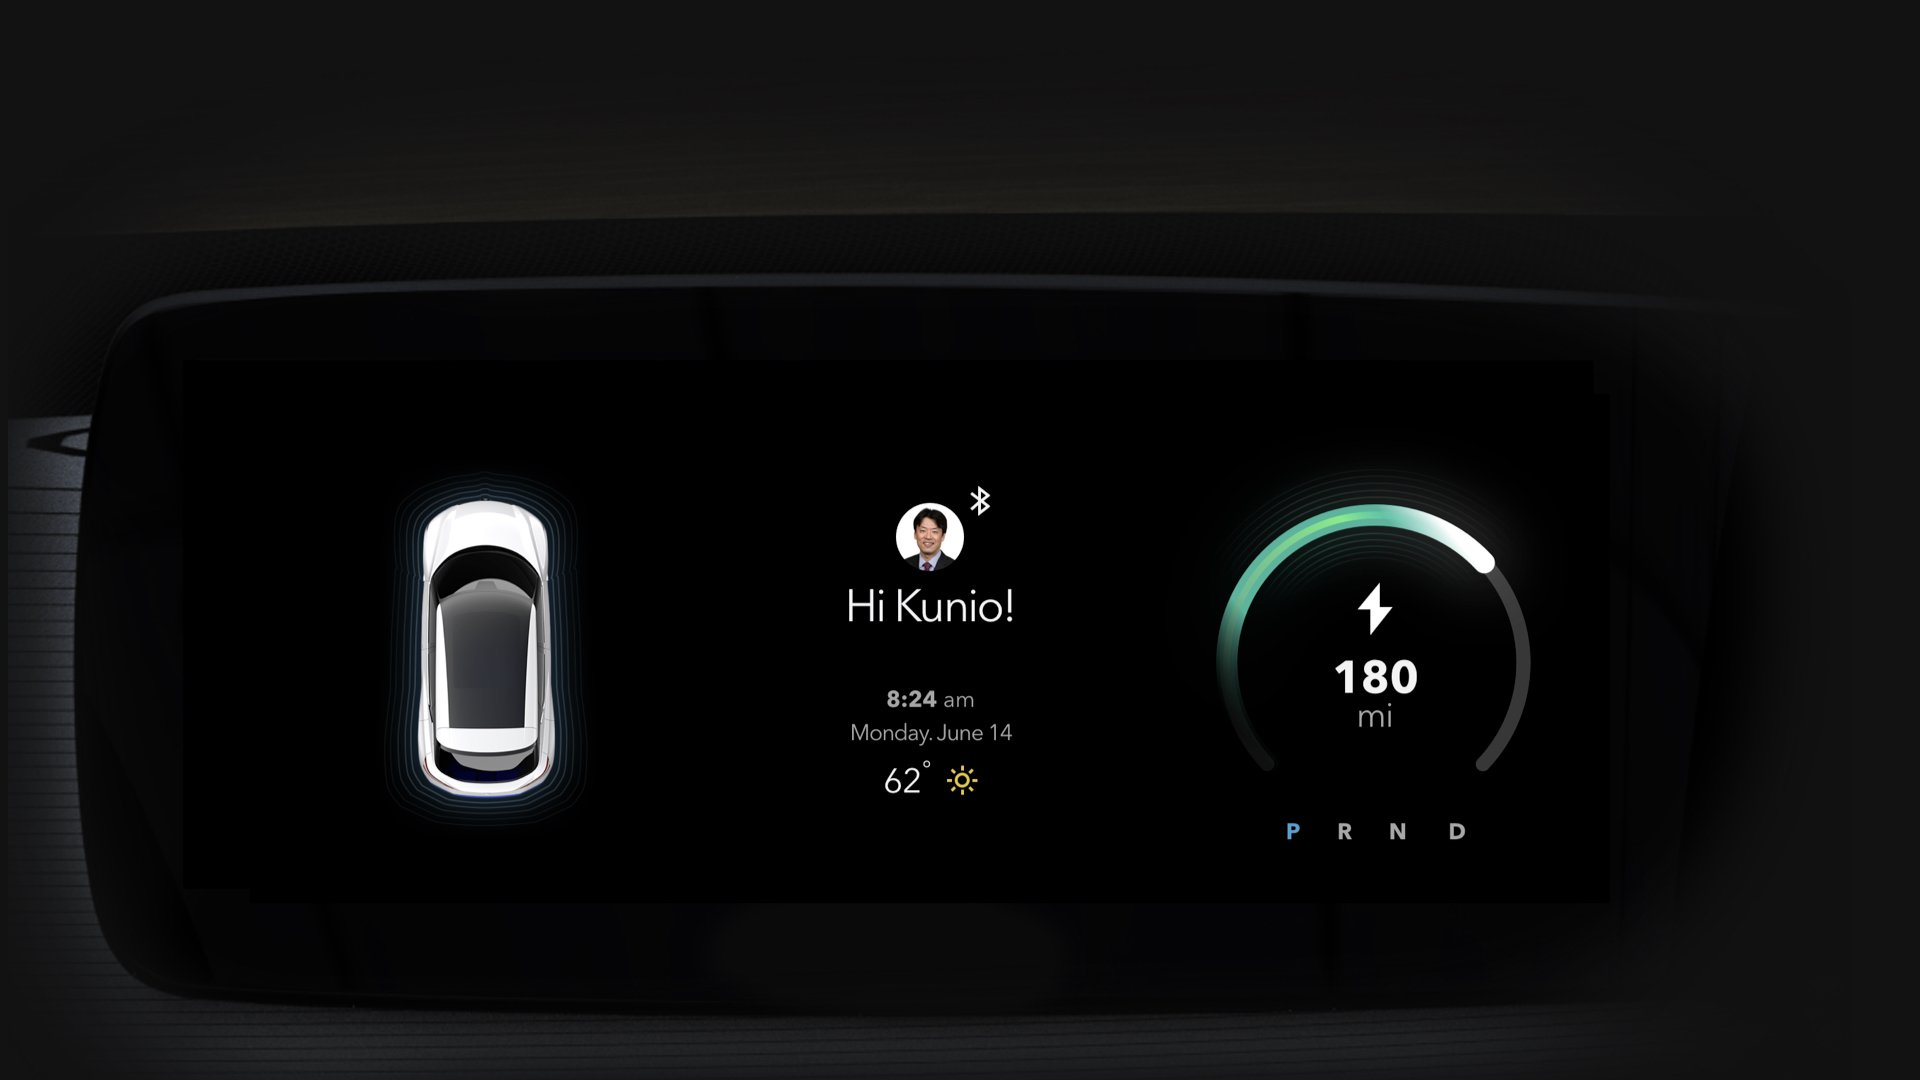
Personalization: Drivers expected the vehicle to automatically recognize them and safely learn their comfort preferences over time without distracting them while driving.
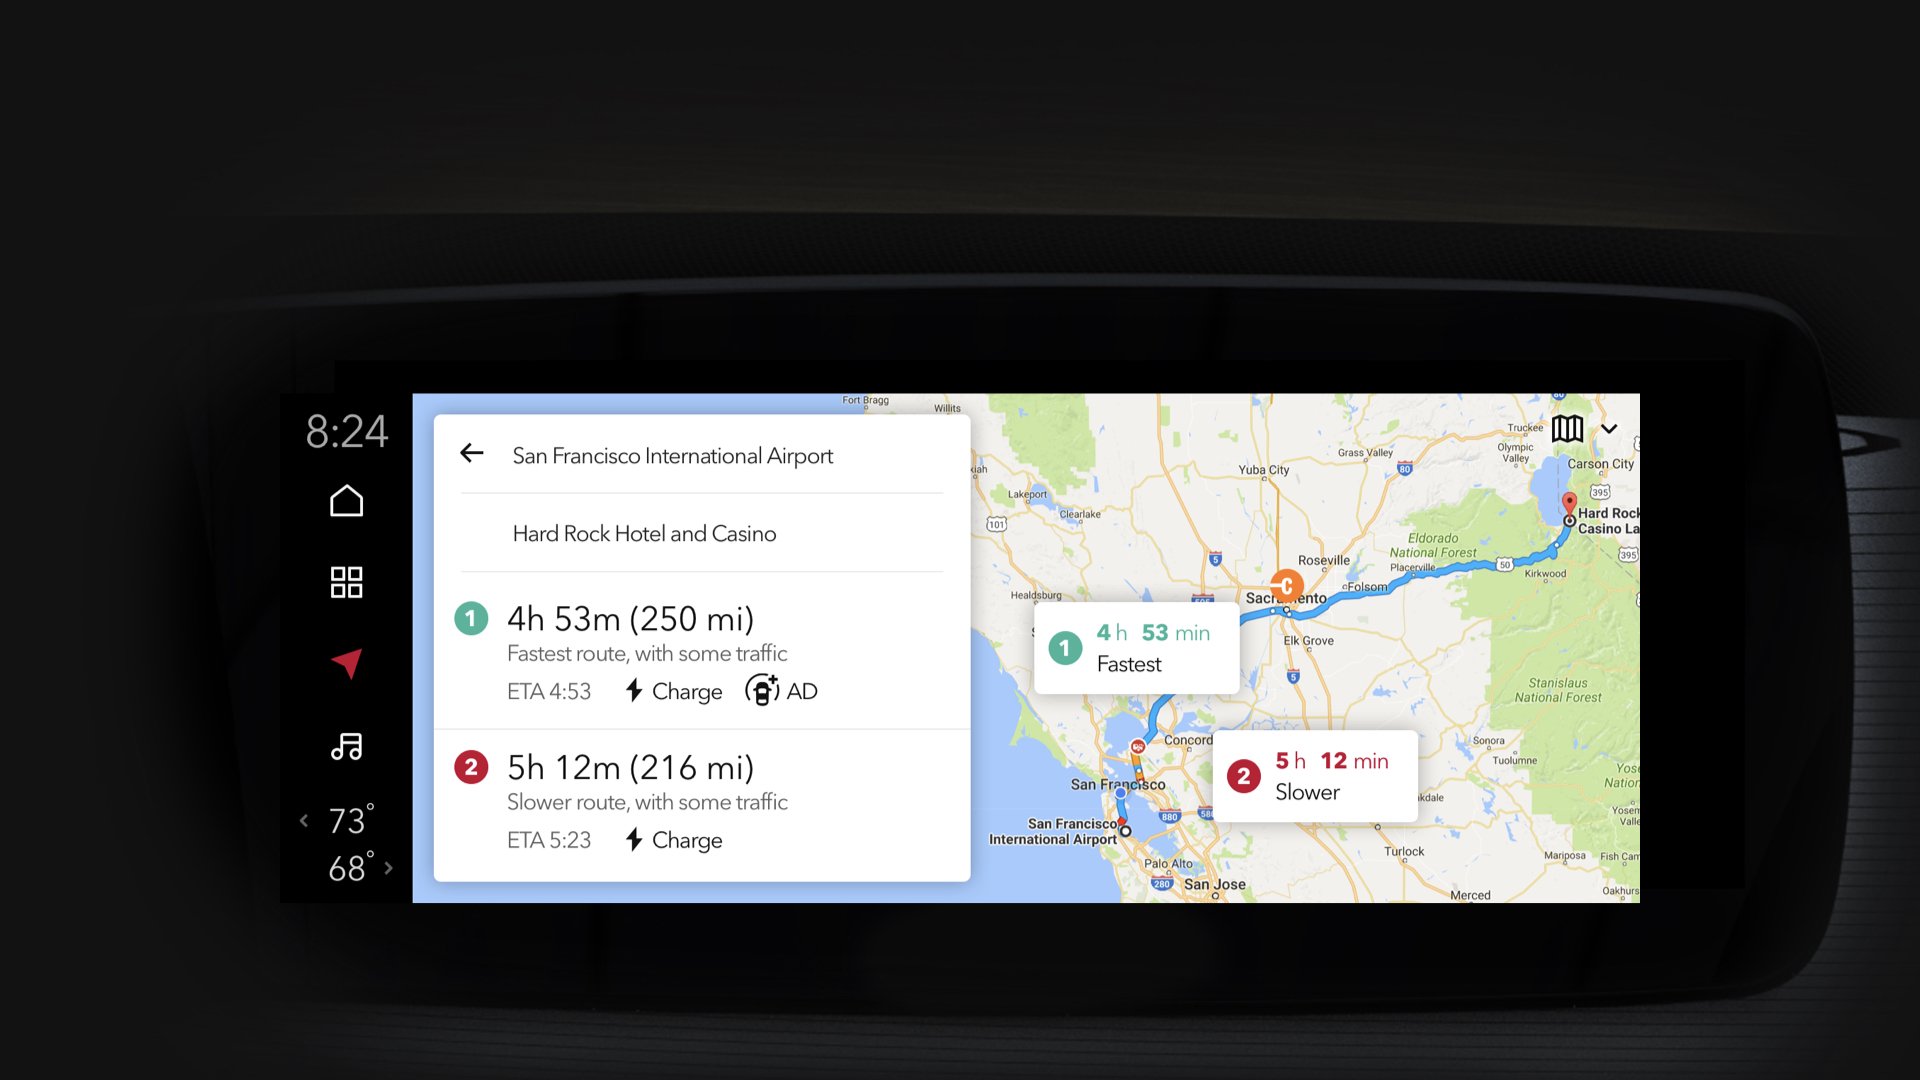
Convenience: The digital workspace needed to make typical electric vehicle pain points, like range anxiety and finding functional chargers, completely invisible.
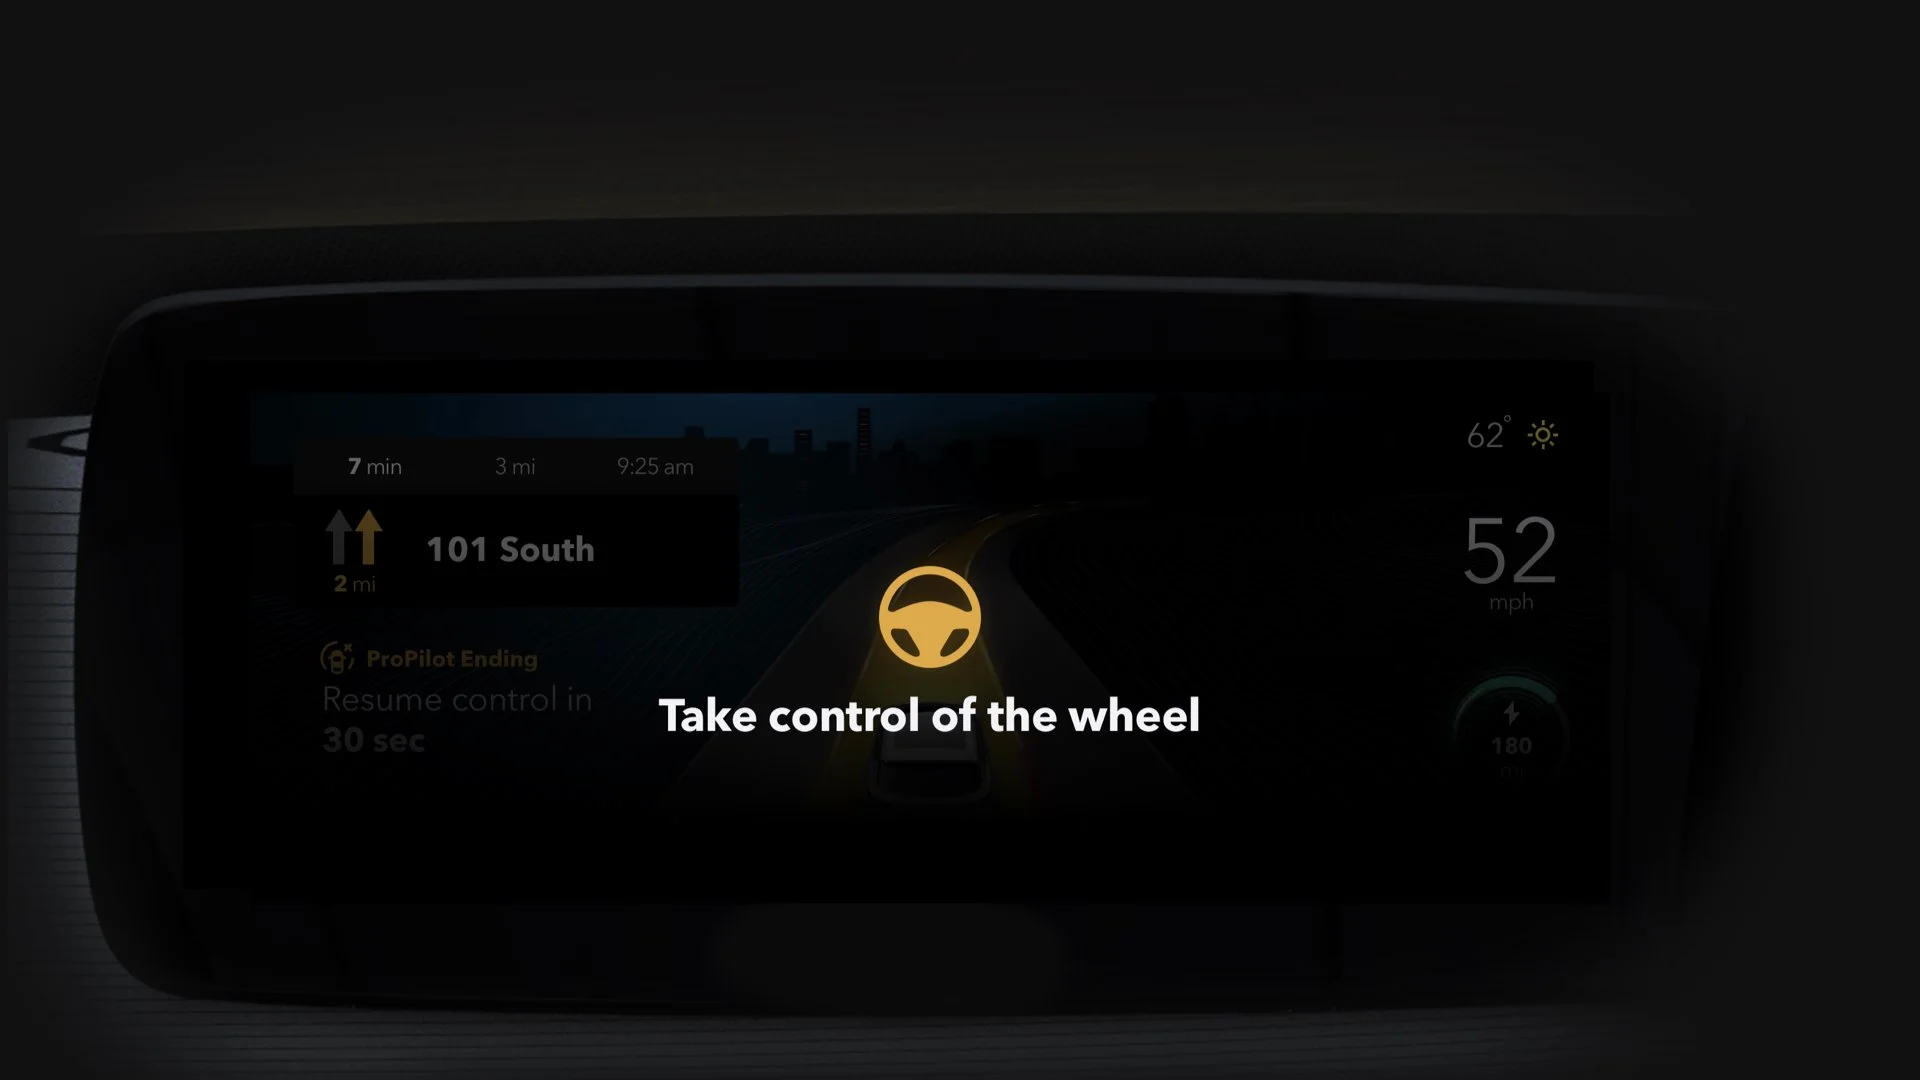
Trust: Users were open to semi-autonomous driving features, but only if the interface clearly communicated what the car was doing at all times.
Conceptualizing the System Architecture
We began sketching interaction concepts around the core needs we uncovered in our interview sessions. These were then translated into sketches of detailed user stories for our primary driving profiles. This process allowed us to cull weak ideas early and prioritize the interface concepts that added direct value to our target users’ daily commute patterns.
Cross-Display Interaction Principles
We mapped out a holistic information architecture to coordinate how data moved between four separate touchpoints: the digital meter cluster behind the steering wheel, the central infotainment display, the heads-up display on the windshield, and the companion smartphone app.
To govern this complex system, I established four primary interaction pillars based on our field research:
Minimize Visual Workload: Show data contextually so the driver never feels overwhelmed.
Prioritize Primary Actions: Keep everyday tasks directly on the root screen layer while burying deep settings.
Seamless Device Continuity: Allow personal devices to connect automatically without compromising driver data privacy.
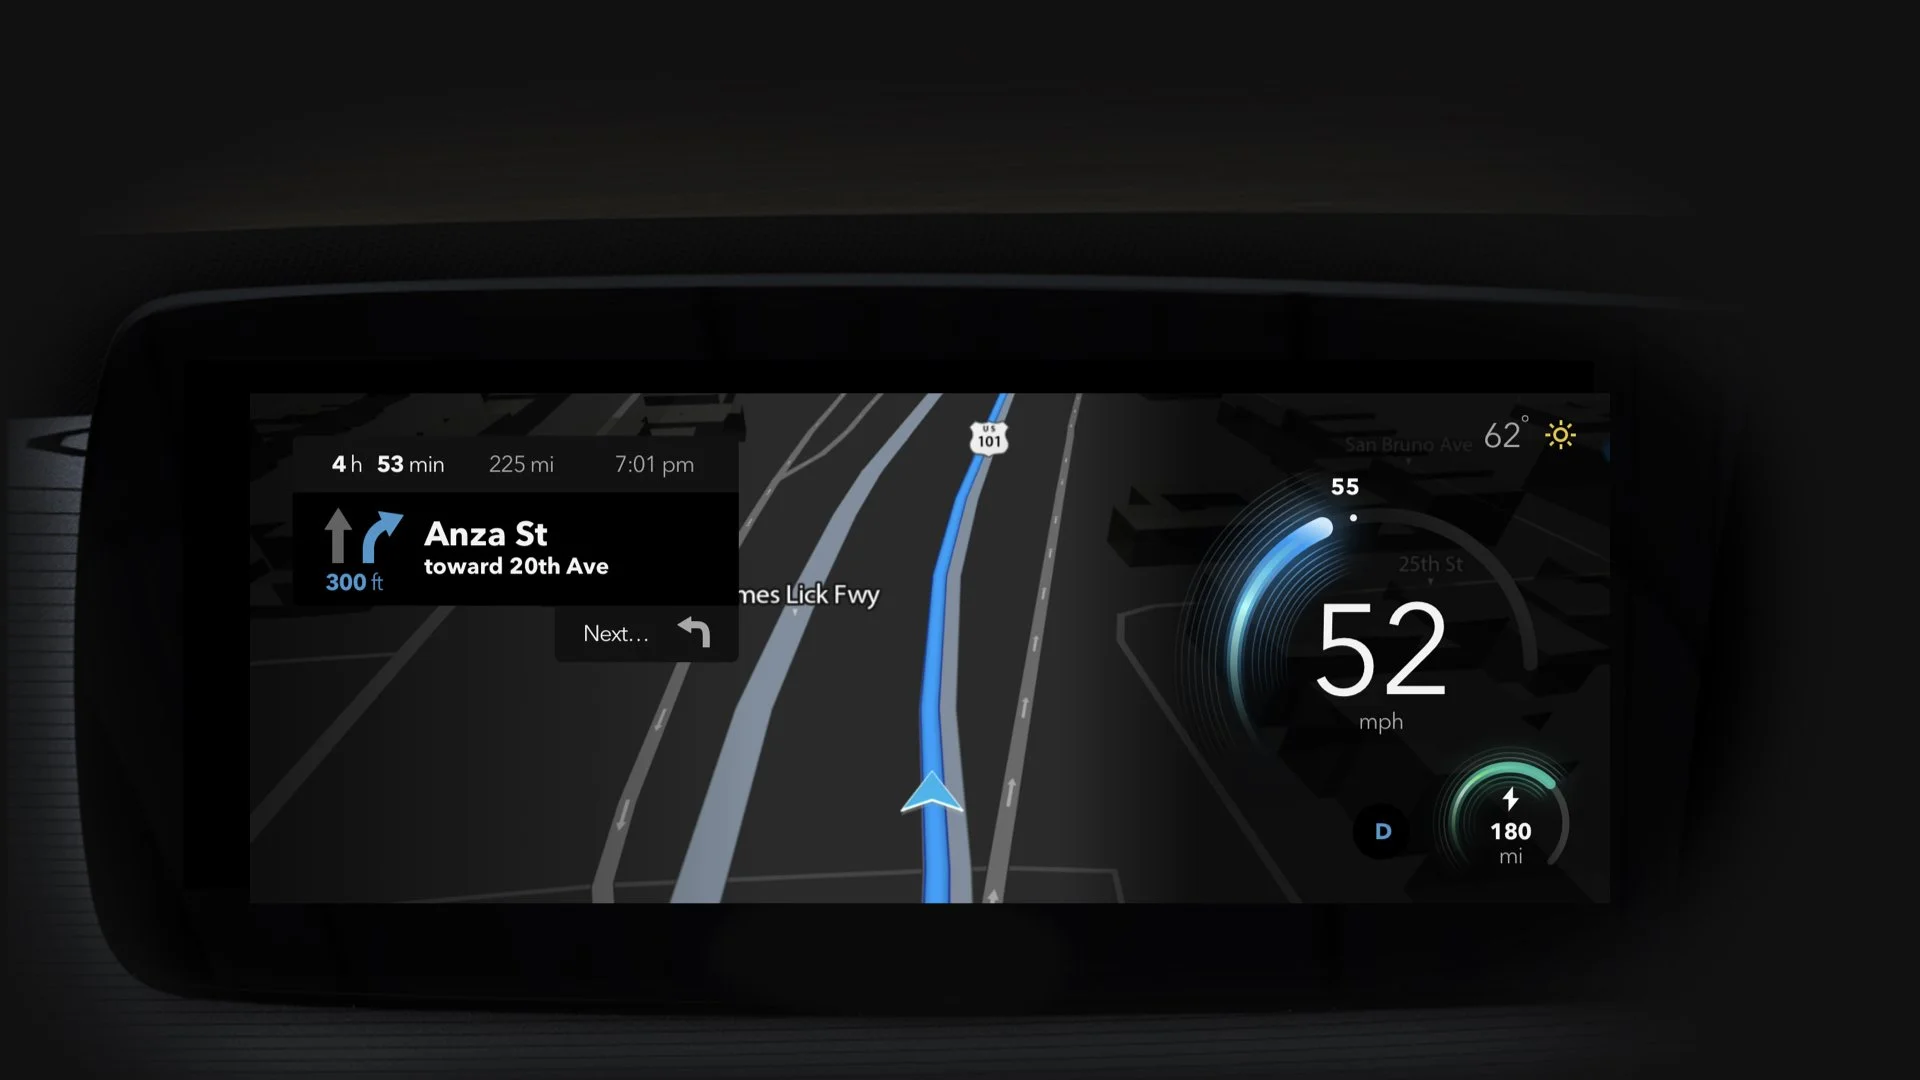
Meter (Behind Steering Wheel)
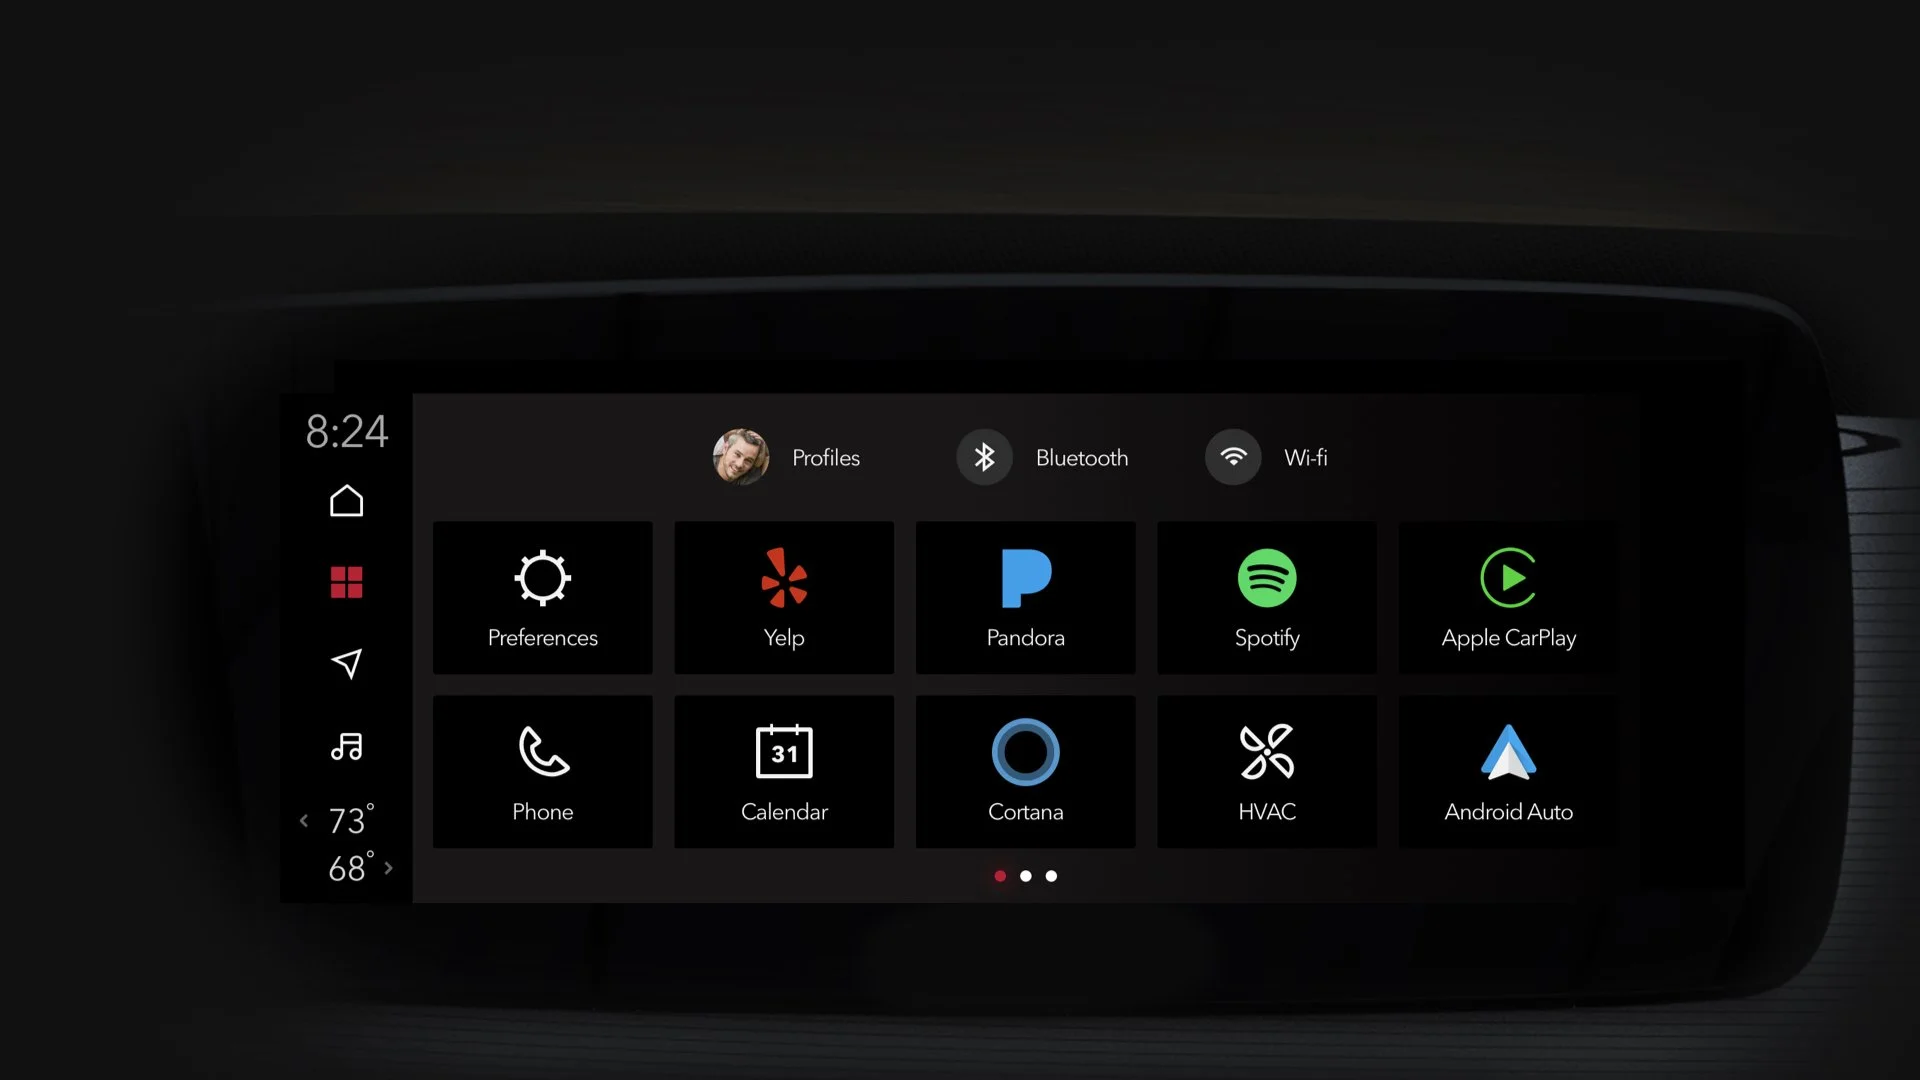
CID (Infotainment Screen)
Agile Prototyping and Weekly Sprint Validation
To validate our layouts without losing momentum, we launched a continuous five-week usability testing program. We ran tests weekly, immediately iterating on the designs based on driver feedback and performance data.
We built a physical testing simulator equipped with three active digital screens representing the instrument cluster, the main infotainment screen, and the heads-up display. We also mounted printed controls on a physical steering wheel to replicate tactical inputs. Participants executed complex driving tasks while we tracked their comprehension across seven key areas of the dashboard interface.
Final Designs
Meter (behind steering wheel)
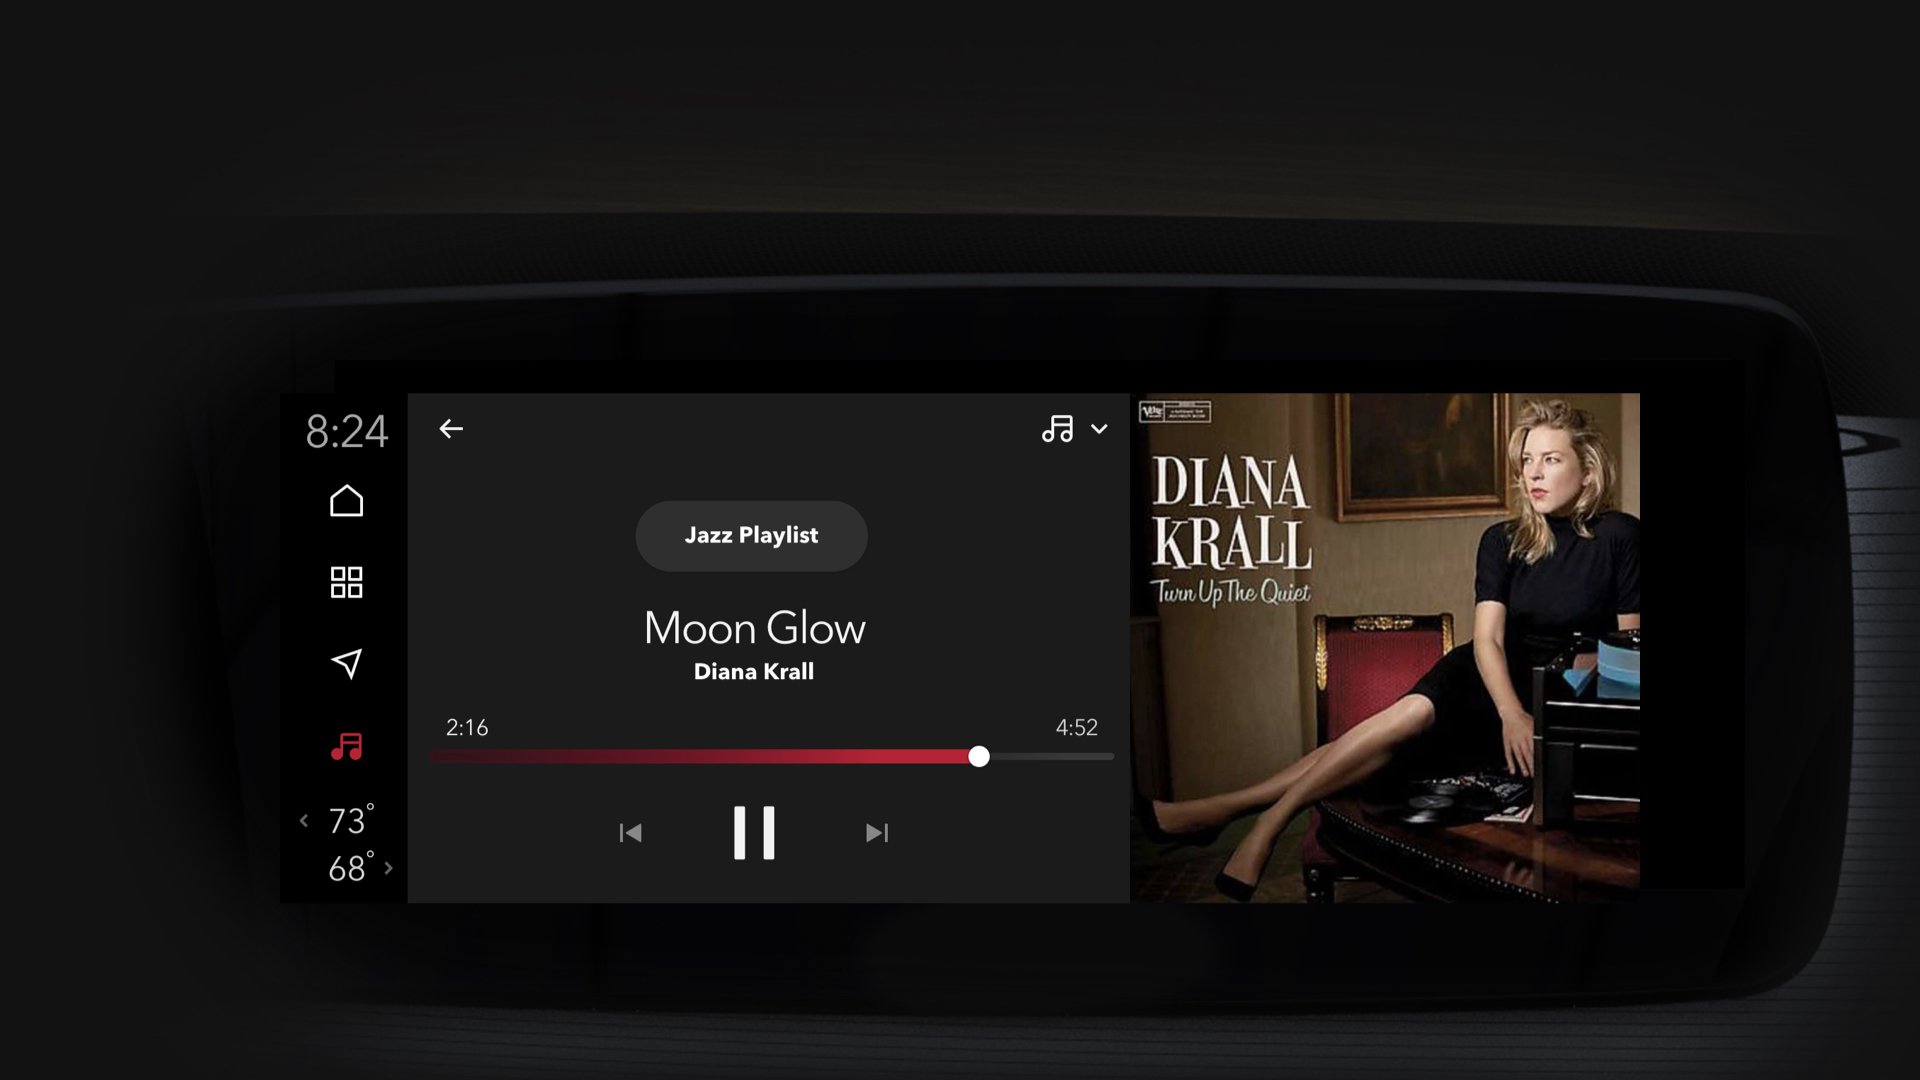
CID (infotainment screen)
Strategic System Handoff
Our iterative sprint cycles resulted in a highly polished, interactive software package. By grounding our interaction patterns in verified human driving habits, we delivered a validated blueprint that defined Nissan's future electric cockpit layout.